Note
Go to the end to download the full example code.
Multiclass Classification
This example uses the iris dataset and performs multiclass
classification using a Support Vector Machine classifier and plots
heatmaps for cross-validation accuracies and plots confusion matrix
for the test data.
# Authors: Shammi More <s.more@fz-juelich.de>
#          Federico Raimondo <f.raimondo@fz-juelich.de>
# License: AGPL

import pandas as pd
import seaborn as sns
import numpy as np
import matplotlib.pyplot as plt
from seaborn import load_dataset
from sklearn.model_selection import train_test_split, RepeatedKFold
from sklearn.metrics import confusion_matrix

from julearn import run_cross_validation
from julearn.utils import configure_logging
Set the logging level to info to see extra information
configure_logging(level="INFO")
2026-07-21 10:58:16,612 - julearn - INFO - ===== Lib Versions =====
2026-07-21 10:58:16,613 - julearn - INFO - numpy: 2.5.1
2026-07-21 10:58:16,613 - julearn - INFO - scipy: 1.18.0
2026-07-21 10:58:16,613 - julearn - INFO - sklearn: 1.8.0
2026-07-21 10:58:16,613 - julearn - INFO - pandas: 3.0.3
2026-07-21 10:58:16,613 - julearn - INFO - julearn: 0.3.6.dev75
2026-07-21 10:58:16,613 - julearn - INFO - ========================
load the iris data from seaborn
Split the dataset into train and test
train_iris, test_iris = train_test_split(
    df_iris, test_size=0.2, stratify=df_iris[y], random_state=200
)
We want to perform multiclass classification as iris dataset contains 3 kinds of species. We will first zscore all the features and then train a support vector machine classifier.
cv = RepeatedKFold(n_splits=5, n_repeats=5, random_state=200)
scores, model_iris = run_cross_validation(
    X=X,
    y=y,
    data=train_iris,
    model="svm",
    preprocess="zscore",
    problem_type="classification",
    cv=cv,
    scoring=["accuracy"],
    return_estimator="final",
)
2026-07-21 10:58:16,617 - julearn - INFO - ==== Input Data ====
2026-07-21 10:58:16,617 - julearn - INFO - Using dataframe as input
2026-07-21 10:58:16,617 - julearn - INFO -      Features: ['sepal_length', 'sepal_width', 'petal_length']
2026-07-21 10:58:16,618 - julearn - INFO -      Target: species
2026-07-21 10:58:16,618 - julearn - INFO -      Expanded features: ['sepal_length', 'sepal_width', 'petal_length']
2026-07-21 10:58:16,618 - julearn - INFO -      X_types:{}
2026-07-21 10:58:16,618 - julearn - WARNING - The following columns are not defined in X_types: ['sepal_length', 'sepal_width', 'petal_length']. They will be treated as continuous.
/tmp/tmpp8_t5ngz/julearn/prepare.py:609: RuntimeWarning: The following columns are not defined in X_types: ['sepal_length', 'sepal_width', 'petal_length']. They will be treated as continuous.
  warn_with_log(
2026-07-21 10:58:16,619 - julearn - INFO - ====================
2026-07-21 10:58:16,619 - julearn - INFO -
2026-07-21 10:58:16,620 - julearn - INFO - Adding step zscore that applies to ColumnTypes<types={'continuous'}; pattern=(?:__:type:__continuous)>
2026-07-21 10:58:16,620 - julearn - INFO - Step added
2026-07-21 10:58:16,620 - julearn - INFO - Adding step svm that applies to ColumnTypes<types={'continuous'}; pattern=(?:__:type:__continuous)>
2026-07-21 10:58:16,620 - julearn - INFO - Step added
2026-07-21 10:58:16,621 - julearn - INFO - = Model Parameters =
2026-07-21 10:58:16,621 - julearn - INFO - ====================
2026-07-21 10:58:16,621 - julearn - INFO -
2026-07-21 10:58:16,621 - julearn - INFO - = Data Information =
2026-07-21 10:58:16,621 - julearn - INFO -      Problem type: classification
2026-07-21 10:58:16,621 - julearn - INFO -      Number of samples: 120
2026-07-21 10:58:16,622 - julearn - INFO -      Number of features: 3
2026-07-21 10:58:16,622 - julearn - INFO - ====================
2026-07-21 10:58:16,622 - julearn - INFO -
2026-07-21 10:58:16,622 - julearn - INFO -      Number of classes: 3
2026-07-21 10:58:16,622 - julearn - INFO -      Target type: str
2026-07-21 10:58:16,623 - julearn - INFO -      Class distributions: species
versicolor    40
virginica     40
setosa        40
Name: count, dtype: int64
2026-07-21 10:58:16,624 - julearn - INFO - Using outer CV scheme RepeatedKFold(n_repeats=5, n_splits=5, random_state=200) (incl. final model)
2026-07-21 10:58:16,624 - julearn - WARNING - The kind of values in y (str) is not suitable for a classification. Values should be numeric.
/tmp/tmpp8_t5ngz/julearn/prepare.py:422: RuntimeWarning: The kind of values in y (str) is not suitable for a classification. Values should be numeric.
  warn_with_log(
2026-07-21 10:58:16,625 - julearn - INFO - Multi-class classification problem detected #classes = 3.
The scores dataframe has all the values for each CV split.
Now we can get the accuracy per fold and repetition:
df_accuracy = scores.set_index(["repeat", "fold"])["test_accuracy"].unstack()
df_accuracy.index.name = "Repeats"
df_accuracy.columns.name = "K-fold splits"
df_accuracy
Plot heatmap of accuracy over all repeats and CV splits
sns.set(font_scale=1.2)
fig, ax = plt.subplots(1, 1, figsize=(10, 7))
sns.heatmap(df_accuracy, cmap="YlGnBu")
plt.title("Cross-validation Accuracy")
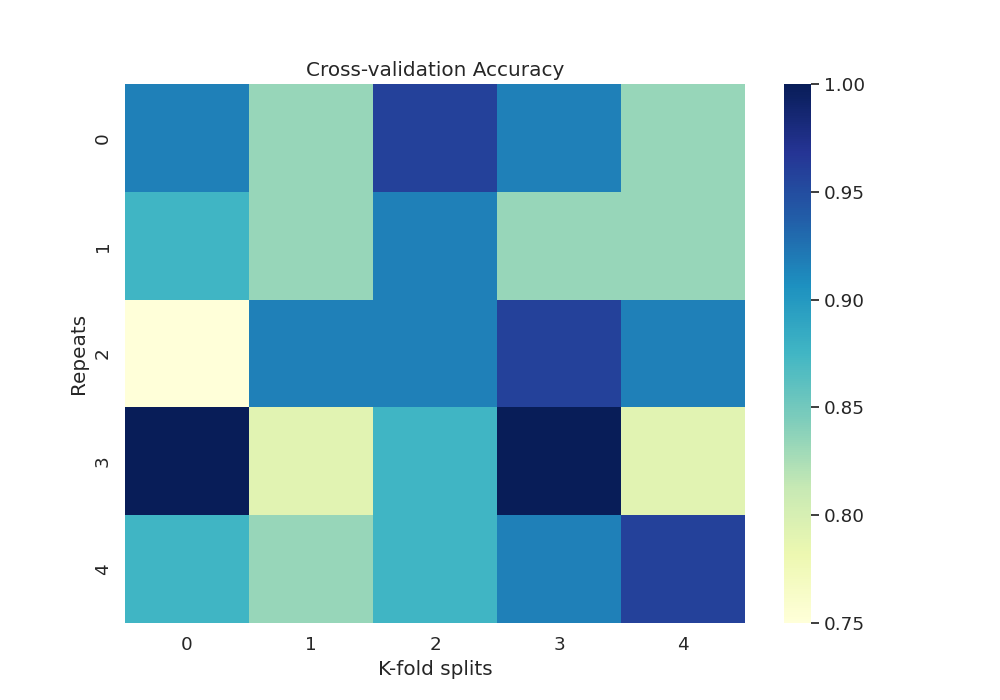
Text(0.5, 1.0, 'Cross-validation Accuracy')
We can also test our final model’s accuracy and plot the confusion matrix for the test data as an annotated heatmap
[[9 1 0]
 [0 9 1]
 [0 2 8]]
Now that we have our confusion matrix, let’s build another matrix with annotations.
Finally we create another dataframe with the confusion matrix and plot the heatmap with annotations.
cm = pd.DataFrame(cm, index=np.unique(y_true), columns=np.unique(y_true))
cm.index.name = "Actual"
cm.columns.name = "Predicted"

fig, ax = plt.subplots(1, 1, figsize=(10, 7))
sns.heatmap(cm, cmap="YlGnBu", annot=annot, fmt="", ax=ax)
plt.title("Confusion matrix")
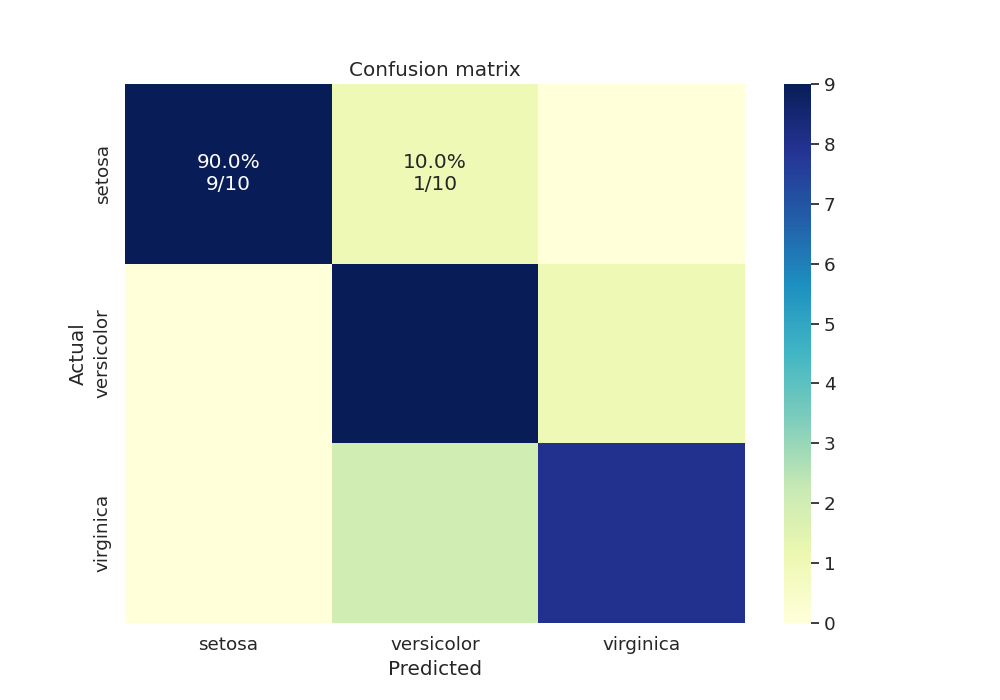
Text(0.5, 1.0, 'Confusion matrix')
Total running time of the script: (0 minutes 0.572 seconds)