Note
Go to the end to download the full example code
Stratified K-fold CV for regression analysis#
This example uses the ‘diabetes’ data from sklearn datasets to perform stratified Kfold CV for a regression problem,
# Authors: Shammi More <s.more@fz-juelich.de>
#          Federico Raimondo <f.raimondo@fz-juelich.de>
#          Leonard Sasse <l.sasse@fz-juelich.de>
# License: AGPL

import math
import pandas as pd
import seaborn as sns
import matplotlib.pyplot as plt
from sklearn.datasets import load_diabetes
from sklearn.model_selection import KFold

from julearn import run_cross_validation
from julearn.utils import configure_logging
from julearn.model_selection import ContinuousStratifiedKFold
Set the logging level to info to see extra information
configure_logging(level="INFO")
2026-05-29 20:45:53,619 - julearn - INFO - ===== Lib Versions =====
2026-05-29 20:45:53,619 - julearn - INFO - numpy: 1.25.2
2026-05-29 20:45:53,620 - julearn - INFO - scipy: 1.16.3
2026-05-29 20:45:53,620 - julearn - INFO - sklearn: 1.3.0
2026-05-29 20:45:53,620 - julearn - INFO - pandas: 2.0.3
2026-05-29 20:45:53,620 - julearn - INFO - julearn: 0.3.1.dev0
2026-05-29 20:45:53,620 - julearn - INFO - ========================
load the diabetes data from sklearn as a pandas dataframe
features, target = load_diabetes(return_X_y=True, as_frame=True)
Dataset contains ten variables age, sex, body mass index, average blood pressure, and six blood serum measurements (s1-s6) diabetes patients and a quantitative measure of disease progression one year after baseline which is the target we are interested in predicting.
print("Features: \n", features.head())
print("Target: \n", target.describe())
Features:
         age       sex       bmi        bp        s1        s2        s3        s4        s5        s6
0  0.038076  0.050680  0.061696  0.021872 -0.044223 -0.034821 -0.043401 -0.002592  0.019907 -0.017646
1 -0.001882 -0.044642 -0.051474 -0.026328 -0.008449 -0.019163  0.074412 -0.039493 -0.068332 -0.092204
2  0.085299  0.050680  0.044451 -0.005670 -0.045599 -0.034194 -0.032356 -0.002592  0.002861 -0.025930
3 -0.089063 -0.044642 -0.011595 -0.036656  0.012191  0.024991 -0.036038  0.034309  0.022688 -0.009362
4  0.005383 -0.044642 -0.036385  0.021872  0.003935  0.015596  0.008142 -0.002592 -0.031988 -0.046641
Target:
 count    442.000000
mean     152.133484
std       77.093005
min       25.000000
25%       87.000000
50%      140.500000
75%      211.500000
max      346.000000
Name: target, dtype: float64
Let’s combine features and target together in one dataframe and create some outliers to see the difference in model performance with and without stratification
data_df = pd.concat([features, target], axis=1)

# Create outliers for test purpose
new_df = data_df[(data_df.target > 145) & (data_df.target <= 150)]
new_df["target"] = [590, 580, 597, 595, 590, 590, 600]
data_df = pd.concat([data_df, new_df], axis=0)
data_df = data_df.reset_index(drop=True)

# define X, y
X = ["age", "sex", "bmi", "bp", "s1", "s2", "s3", "s4", "s5", "s6"]
y = "target"
/private/var/folders/09/t22x2_p106j7p24khr0jdxrw0000gn/T/tmp4590_ea2/examples/00_starting/plot_stratified_kfold_reg.py:53: SettingWithCopyWarning:
A value is trying to be set on a copy of a slice from a DataFrame.
Try using .loc[row_indexer,col_indexer] = value instead

See the caveats in the documentation: https://pandas.pydata.org/pandas-docs/stable/user_guide/indexing.html#returning-a-view-versus-a-copy
  new_df["target"] = [590, 580, 597, 595, 590, 590, 600]
Define number of bins/group for stratification. The idea is that each “bin” will be equally represented in each fold. The number of bins should be chosen such that each bin has a sufficient number of samples so that each fold has more than one sample from each bin. Let’s see a couple of histrograms with different number of bins.
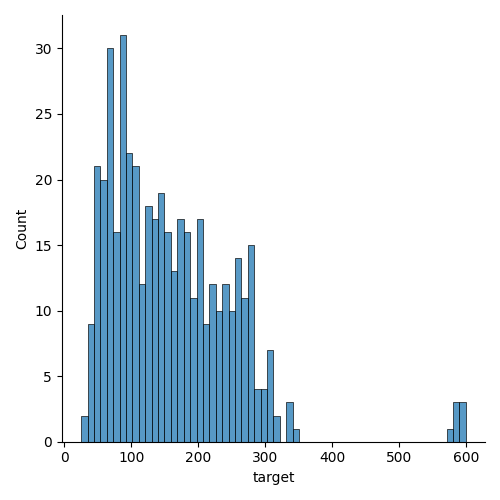
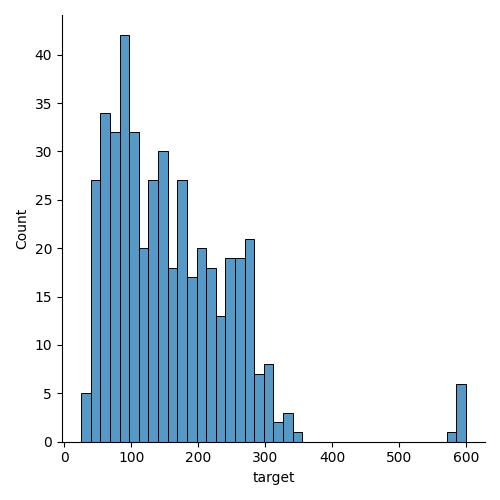
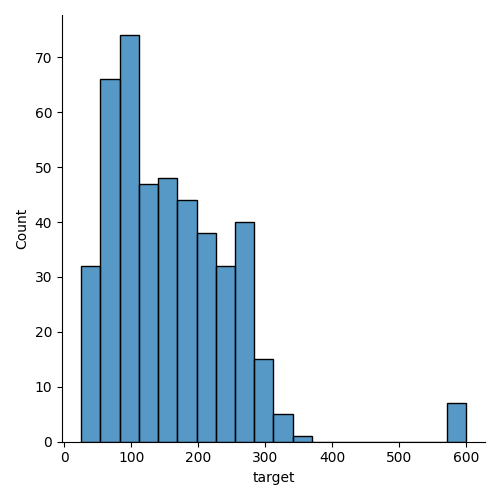
<seaborn.axisgrid.FacetGrid object at 0x12e228ad0>
From the histogram above, we can see that the data is not uniformly distributed. We can see that the data is skewed towards the lower end of the target variable. We can also see that there are some outliers in the data. In any case, even with a low number of splits, some groups will not be represented in each fold. Lets continue with 40 bins which gives a good granularity.
cv_stratified = ContinuousStratifiedKFold(
    n_bins=40, n_splits=5, shuffle=False
)
Train a linear regression model with stratification on target
2026-05-29 20:45:54,175 - julearn - INFO - ==== Input Data ====
2026-05-29 20:45:54,175 - julearn - INFO - Using dataframe as input
2026-05-29 20:45:54,176 - julearn - INFO -      Features: ['age', 'sex', 'bmi', 'bp', 's1', 's2', 's3', 's4', 's5', 's6']
2026-05-29 20:45:54,176 - julearn - INFO -      Target: target
2026-05-29 20:45:54,176 - julearn - INFO -      Expanded features: ['age', 'sex', 'bmi', 'bp', 's1', 's2', 's3', 's4', 's5', 's6']
2026-05-29 20:45:54,176 - julearn - INFO -      X_types:{}
2026-05-29 20:45:54,176 - julearn - WARNING - The following columns are not defined in X_types: ['age', 'sex', 'bmi', 'bp', 's1', 's2', 's3', 's4', 's5', 's6']. They will be treated as continuous.
/private/var/folders/09/t22x2_p106j7p24khr0jdxrw0000gn/T/tmp4590_ea2/julearn/utils/logging.py:238: RuntimeWarning: The following columns are not defined in X_types: ['age', 'sex', 'bmi', 'bp', 's1', 's2', 's3', 's4', 's5', 's6']. They will be treated as continuous.
  warn(msg, category=category)
2026-05-29 20:45:54,177 - julearn - INFO - ====================
2026-05-29 20:45:54,177 - julearn - INFO -
2026-05-29 20:45:54,178 - julearn - INFO - Adding step zscore that applies to ColumnTypes<types={'continuous'}; pattern=(?:__:type:__continuous)>
2026-05-29 20:45:54,178 - julearn - INFO - Step added
2026-05-29 20:45:54,178 - julearn - INFO - Adding step linreg that applies to ColumnTypes<types={'continuous'}; pattern=(?:__:type:__continuous)>
2026-05-29 20:45:54,178 - julearn - INFO - Step added
2026-05-29 20:45:54,178 - julearn - INFO - = Model Parameters =
2026-05-29 20:45:54,179 - julearn - INFO - ====================
2026-05-29 20:45:54,179 - julearn - INFO -
2026-05-29 20:45:54,179 - julearn - INFO - = Data Information =
2026-05-29 20:45:54,179 - julearn - INFO -      Problem type: regression
2026-05-29 20:45:54,179 - julearn - INFO -      Number of samples: 449
2026-05-29 20:45:54,179 - julearn - INFO -      Number of features: 10
2026-05-29 20:45:54,179 - julearn - INFO - ====================
2026-05-29 20:45:54,179 - julearn - INFO -
2026-05-29 20:45:54,179 - julearn - INFO -      Target type: float64
2026-05-29 20:45:54,179 - julearn - INFO - Using outer CV scheme ContinuousStratifiedKFold(method=None, n_bins=None, n_splits=5,
             random_state=None, shuffle=False)
/private/var/folders/09/t22x2_p106j7p24khr0jdxrw0000gn/T/tmp4590_ea2/.venv/lib/python3.11/site-packages/sklearn/model_selection/_split.py:725: UserWarning: The least populated class in y has only 1 members, which is less than n_splits=5.
  warnings.warn(
/private/var/folders/09/t22x2_p106j7p24khr0jdxrw0000gn/T/tmp4590_ea2/.venv/lib/python3.11/site-packages/sklearn/model_selection/_split.py:725: UserWarning: The least populated class in y has only 1 members, which is less than n_splits=5.
  warnings.warn(
Train a linear regression model without stratification on target
2026-05-29 20:45:54,236 - julearn - INFO - ==== Input Data ====
2026-05-29 20:45:54,236 - julearn - INFO - Using dataframe as input
2026-05-29 20:45:54,236 - julearn - INFO -      Features: ['age', 'sex', 'bmi', 'bp', 's1', 's2', 's3', 's4', 's5', 's6']
2026-05-29 20:45:54,236 - julearn - INFO -      Target: target
2026-05-29 20:45:54,237 - julearn - INFO -      Expanded features: ['age', 'sex', 'bmi', 'bp', 's1', 's2', 's3', 's4', 's5', 's6']
2026-05-29 20:45:54,237 - julearn - INFO -      X_types:{}
2026-05-29 20:45:54,237 - julearn - WARNING - The following columns are not defined in X_types: ['age', 'sex', 'bmi', 'bp', 's1', 's2', 's3', 's4', 's5', 's6']. They will be treated as continuous.
/private/var/folders/09/t22x2_p106j7p24khr0jdxrw0000gn/T/tmp4590_ea2/julearn/utils/logging.py:238: RuntimeWarning: The following columns are not defined in X_types: ['age', 'sex', 'bmi', 'bp', 's1', 's2', 's3', 's4', 's5', 's6']. They will be treated as continuous.
  warn(msg, category=category)
2026-05-29 20:45:54,238 - julearn - INFO - ====================
2026-05-29 20:45:54,238 - julearn - INFO -
2026-05-29 20:45:54,238 - julearn - INFO - Adding step zscore that applies to ColumnTypes<types={'continuous'}; pattern=(?:__:type:__continuous)>
2026-05-29 20:45:54,238 - julearn - INFO - Step added
2026-05-29 20:45:54,239 - julearn - INFO - Adding step linreg that applies to ColumnTypes<types={'continuous'}; pattern=(?:__:type:__continuous)>
2026-05-29 20:45:54,239 - julearn - INFO - Step added
2026-05-29 20:45:54,239 - julearn - INFO - = Model Parameters =
2026-05-29 20:45:54,239 - julearn - INFO - ====================
2026-05-29 20:45:54,239 - julearn - INFO -
2026-05-29 20:45:54,239 - julearn - INFO - = Data Information =
2026-05-29 20:45:54,240 - julearn - INFO -      Problem type: regression
2026-05-29 20:45:54,240 - julearn - INFO -      Number of samples: 449
2026-05-29 20:45:54,240 - julearn - INFO -      Number of features: 10
2026-05-29 20:45:54,240 - julearn - INFO - ====================
2026-05-29 20:45:54,240 - julearn - INFO -
2026-05-29 20:45:54,240 - julearn - INFO -      Target type: float64
2026-05-29 20:45:54,240 - julearn - INFO - Using outer CV scheme KFold(n_splits=5, random_state=None, shuffle=False)
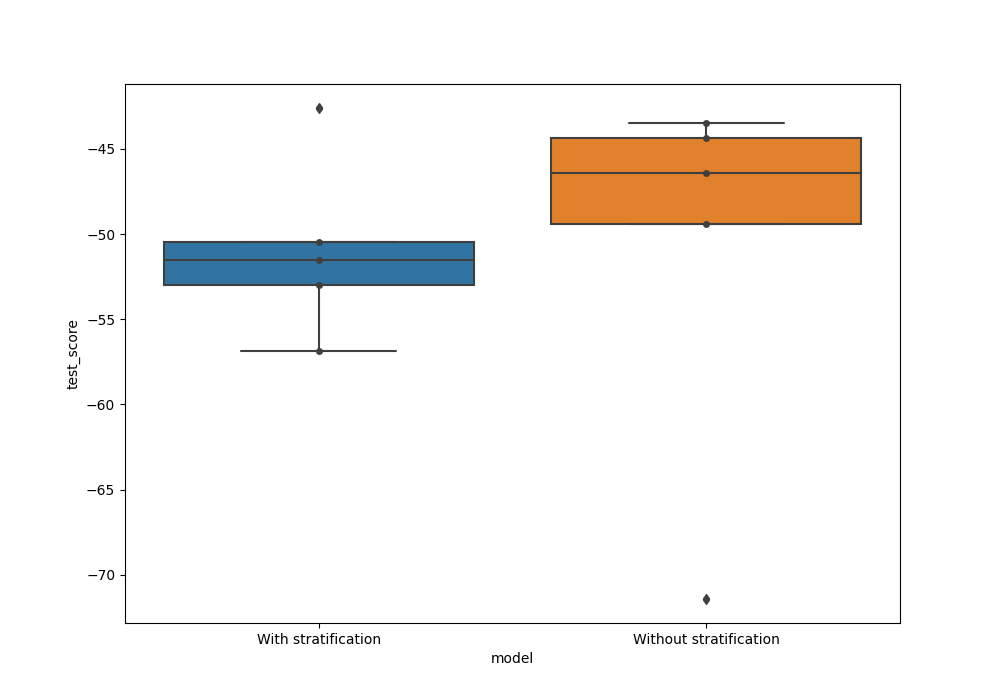
Now we can compare the test score for model trained with and without stratification. We can combine the two outputs as pandas dataframes
scores_strat["model"] = "With stratification"
scores["model"] = "Without stratification"
df_scores = scores_strat[["test_score", "model"]]
df_scores = pd.concat([df_scores, scores[["test_score", "model"]]])
Plot a boxplot with test scores from both the models. We see here that the test score is higher when CV splits were not stratified
Total running time of the script: ( 0 minutes 11.737 seconds)