Note
Go to the end to download the full example code
Multiclass Classification.#
This example uses the ‘iris’ dataset and performs multiclass classification using a Support Vector Machine classifier and plots heatmaps for cross-validation accuracies and plots confusion matrix for the test data.
# Authors: Shammi More <s.more@fz-juelich.de>
#          Federico Raimondo <f.raimondo@fz-juelich.de>
#
# License: AGPL

import pandas as pd
import seaborn as sns
import numpy as np
import matplotlib.pyplot as plt
from seaborn import load_dataset
from sklearn.model_selection import train_test_split, RepeatedKFold
from sklearn.metrics import confusion_matrix

from julearn import run_cross_validation
from julearn.utils import configure_logging
Set the logging level to info to see extra information
configure_logging(level="INFO")
2026-05-29 20:45:38,108 - julearn - INFO - ===== Lib Versions =====
2026-05-29 20:45:38,108 - julearn - INFO - numpy: 1.25.2
2026-05-29 20:45:38,108 - julearn - INFO - scipy: 1.16.3
2026-05-29 20:45:38,108 - julearn - INFO - sklearn: 1.3.0
2026-05-29 20:45:38,109 - julearn - INFO - pandas: 2.0.3
2026-05-29 20:45:38,109 - julearn - INFO - julearn: 0.3.1.dev0
2026-05-29 20:45:38,109 - julearn - INFO - ========================
load the iris data from seaborn
Split the dataset into train and test
train_iris, test_iris = train_test_split(
    df_iris, test_size=0.2, stratify=df_iris[y], random_state=200
)
We want to perform multiclass classification as iris dataset contains 3 kinds of species. We will first zscore all the features and then train a support vector machine classifier.
cv = RepeatedKFold(n_splits=5, n_repeats=5, random_state=200)
scores, model_iris = run_cross_validation(
    X=X,
    y=y,
    data=train_iris,
    model="svm",
    preprocess="zscore",
    problem_type="classification",
    cv=cv,
    scoring=["accuracy"],
    return_estimator="final",
)
2026-05-29 20:45:38,115 - julearn - INFO - ==== Input Data ====
2026-05-29 20:45:38,115 - julearn - INFO - Using dataframe as input
2026-05-29 20:45:38,115 - julearn - INFO -      Features: ['sepal_length', 'sepal_width', 'petal_length']
2026-05-29 20:45:38,115 - julearn - INFO -      Target: species
2026-05-29 20:45:38,115 - julearn - INFO -      Expanded features: ['sepal_length', 'sepal_width', 'petal_length']
2026-05-29 20:45:38,116 - julearn - INFO -      X_types:{}
2026-05-29 20:45:38,116 - julearn - WARNING - The following columns are not defined in X_types: ['sepal_length', 'sepal_width', 'petal_length']. They will be treated as continuous.
/private/var/folders/09/t22x2_p106j7p24khr0jdxrw0000gn/T/tmp4590_ea2/julearn/utils/logging.py:238: RuntimeWarning: The following columns are not defined in X_types: ['sepal_length', 'sepal_width', 'petal_length']. They will be treated as continuous.
  warn(msg, category=category)
2026-05-29 20:45:38,117 - julearn - INFO - ====================
2026-05-29 20:45:38,117 - julearn - INFO -
2026-05-29 20:45:38,117 - julearn - INFO - Adding step zscore that applies to ColumnTypes<types={'continuous'}; pattern=(?:__:type:__continuous)>
2026-05-29 20:45:38,117 - julearn - INFO - Step added
2026-05-29 20:45:38,117 - julearn - INFO - Adding step svm that applies to ColumnTypes<types={'continuous'}; pattern=(?:__:type:__continuous)>
2026-05-29 20:45:38,118 - julearn - INFO - Step added
2026-05-29 20:45:38,118 - julearn - INFO - = Model Parameters =
2026-05-29 20:45:38,119 - julearn - INFO - ====================
2026-05-29 20:45:38,119 - julearn - INFO -
2026-05-29 20:45:38,119 - julearn - INFO - = Data Information =
2026-05-29 20:45:38,119 - julearn - INFO -      Problem type: classification
2026-05-29 20:45:38,119 - julearn - INFO -      Number of samples: 120
2026-05-29 20:45:38,119 - julearn - INFO -      Number of features: 3
2026-05-29 20:45:38,120 - julearn - INFO - ====================
2026-05-29 20:45:38,120 - julearn - INFO -
2026-05-29 20:45:38,120 - julearn - INFO -      Number of classes: 3
2026-05-29 20:45:38,120 - julearn - INFO -      Target type: object
2026-05-29 20:45:38,121 - julearn - INFO -      Class distributions: species
versicolor    40
virginica     40
setosa        40
Name: count, dtype: int64
2026-05-29 20:45:38,122 - julearn - INFO - Using outer CV scheme RepeatedKFold(n_repeats=5, n_splits=5, random_state=200)
2026-05-29 20:45:38,122 - julearn - INFO - Multi-class classification problem detected #classes = 3.
The scores dataframe has all the values for each CV split.
print(scores.head())
   fit_time  score_time  test_accuracy  n_train  n_test  repeat  fold                          cv_mdsum
0  0.007772    0.004992       0.916667       96      24       0     0  fa5ab7a2b930761687a8e82d9971ebca
1  0.009157    0.004324       0.833333       96      24       0     1  fa5ab7a2b930761687a8e82d9971ebca
2  0.007800    0.004555       0.958333       96      24       0     2  fa5ab7a2b930761687a8e82d9971ebca
3  0.008196    0.004540       0.916667       96      24       0     3  fa5ab7a2b930761687a8e82d9971ebca
4  0.007272    0.004188       0.833333       96      24       0     4  fa5ab7a2b930761687a8e82d9971ebca
Now we can get the accuracy per fold and repetition:
df_accuracy = scores.set_index(["repeat", "fold"])["test_accuracy"].unstack()
df_accuracy.index.name = "Repeats"
df_accuracy.columns.name = "K-fold splits"
print(df_accuracy)
K-fold splits         0         1         2         3         4
Repeats
0              0.916667  0.833333  0.958333  0.916667  0.833333
1              0.875000  0.833333  0.916667  0.833333  0.833333
2              0.750000  0.916667  0.916667  0.958333  0.916667
3              1.000000  0.791667  0.875000  1.000000  0.791667
4              0.875000  0.833333  0.875000  0.916667  0.958333
Plot heatmap of accuracy over all repeats and CV splits
sns.set(font_scale=1.2)
fig, ax = plt.subplots(1, 1, figsize=(10, 7))
sns.heatmap(df_accuracy, cmap="YlGnBu")
plt.title("Cross-validation Accuracy")
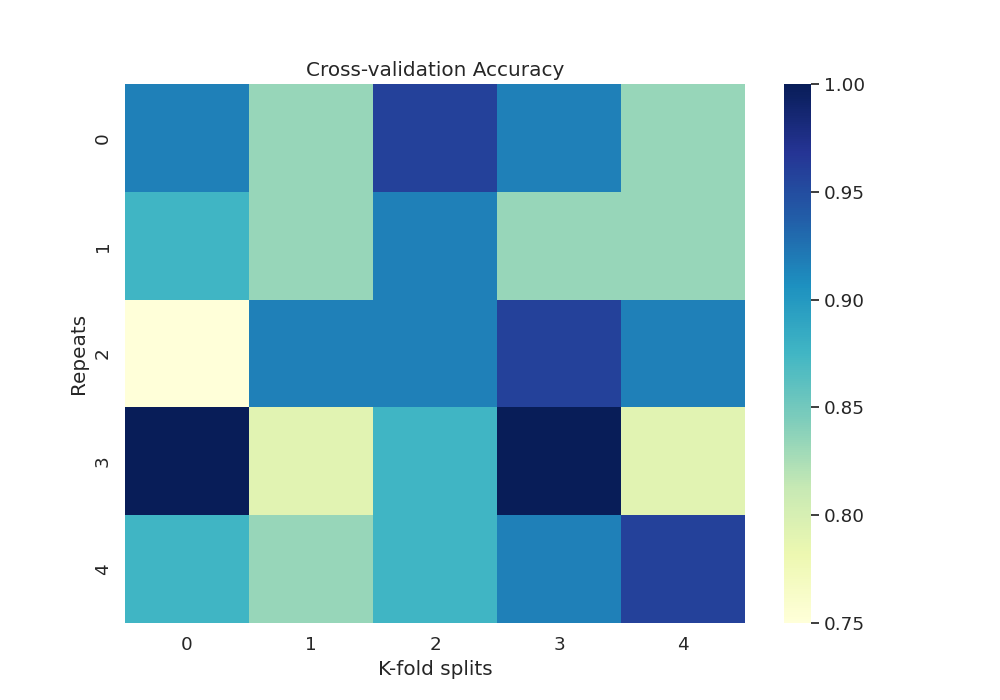
Text(0.5, 1.0, 'Cross-validation Accuracy')
We can also test our final model’s accuracy and plot the confusion matrix for the test data as an annotated heatmap
[[9 1 0]
 [0 9 1]
 [0 2 8]]
Now that we have our confusion matrix, let’s build another matrix with annotations.
cm_sum = np.sum(cm, axis=1, keepdims=True)
cm_perc = cm / cm_sum.astype(float) * 100
annot = np.empty_like(cm).astype(str)
nrows, ncols = cm.shape
for i in range(nrows):
    for j in range(ncols):
        c = cm[i, j]
        p = cm_perc[i, j]
        if c == 0:
            annot[i, j] = ""
        else:
            s = cm_sum[i]
            annot[i, j] = "%.1f%%\n%d/%d" % (p, c, s)
/private/var/folders/09/t22x2_p106j7p24khr0jdxrw0000gn/T/tmp4590_ea2/examples/00_starting/plot_cm_acc_multiclass.py:104: DeprecationWarning: Conversion of an array with ndim > 0 to a scalar is deprecated, and will error in future. Ensure you extract a single element from your array before performing this operation. (Deprecated NumPy 1.25.)
  annot[i, j] = "%.1f%%\n%d/%d" % (p, c, s)
Finally we create another dataframe with the confusion matrix and plot the heatmap with annotations.
cm = pd.DataFrame(cm, index=np.unique(y_true), columns=np.unique(y_true))
cm.index.name = "Actual"
cm.columns.name = "Predicted"
fig, ax = plt.subplots(1, 1, figsize=(10, 7))
sns.heatmap(cm, cmap="YlGnBu", annot=annot, fmt="", ax=ax)
plt.title("Confusion matrix")
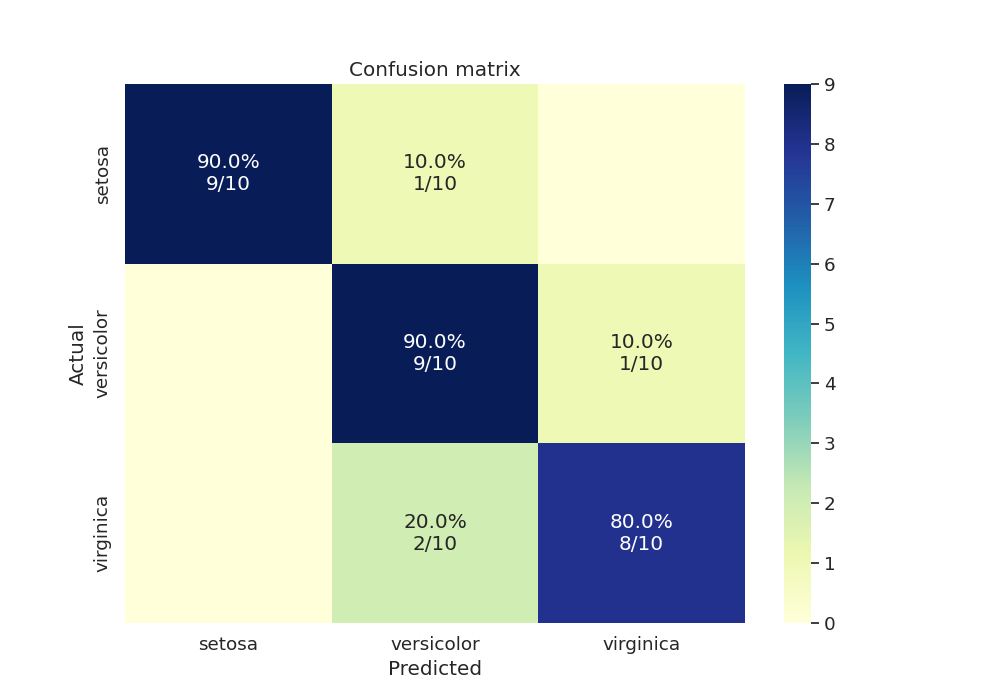
Text(0.5, 1.0, 'Confusion matrix')
Total running time of the script: ( 0 minutes 4.375 seconds)