Note
Click here to download the full example code
Faces Decomposition
Implemented based on scikit-learn’s decomposition example.
Authors: Federico Raimondo, Vlad Niculae, Alexandre Gramfort
License: BSD 3 clause
Out:
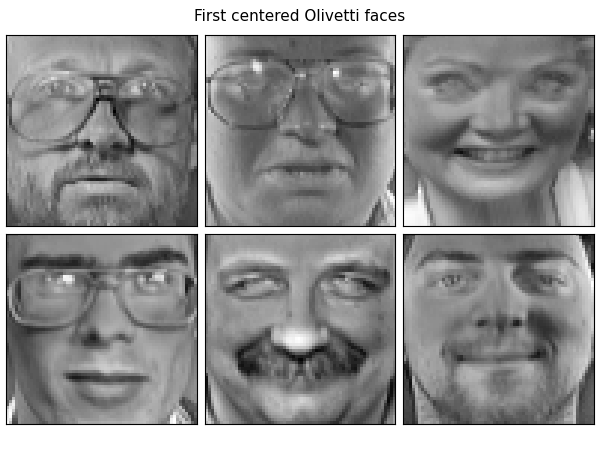
Dataset consists of 400 faces
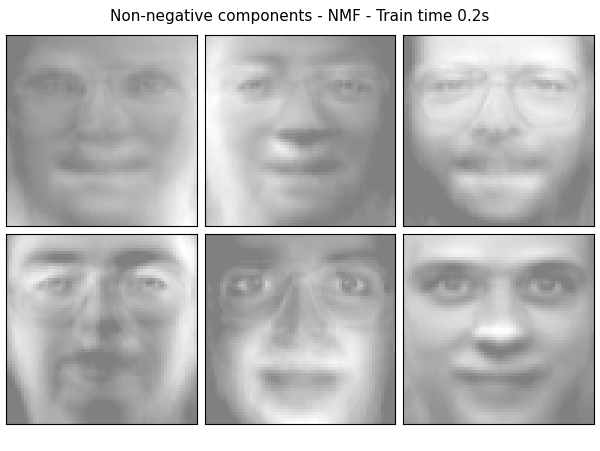
Extracting the top 6 Non-negative components - NMF...
done in 0.219s
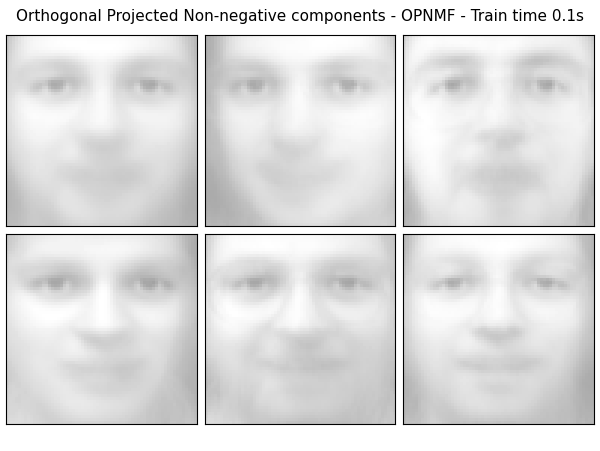
Extracting the top 6 Orthogonal Projected Non-negative components - OPNMF...
2021-09-02 13:05:21,694 INFO Initializing using nndsvd
2021-09-02 13:05:21,754 INFO iter=0 diff=0.9636634588241577, obj=155.62796020507812
2021-09-02 13:05:21,801 INFO Converged in 80 iterations
done in 0.113s
import logging
from time import time

from numpy.random import RandomState
import matplotlib.pyplot as plt

from sklearn.datasets import fetch_olivetti_faces
from sklearn import decomposition

from opnmf import OPNMF

# Display progress logs on stdout
logging.basicConfig(level=logging.INFO,
                    format='%(asctime)s %(levelname)s %(message)s')
n_row, n_col = 2, 3
n_components = n_row * n_col
image_shape = (64, 64)
rng = RandomState(0)


# #############################################################################
# Load faces data
faces, _ = fetch_olivetti_faces(return_X_y=True, shuffle=True,
                                random_state=rng)
n_samples, n_features = faces.shape

# global centering
faces_centered = faces - faces.mean(axis=0)

# local centering
faces_centered -= faces_centered.mean(axis=1).reshape(n_samples, -1)

print("Dataset consists of %d faces" % n_samples)


def plot_gallery(title, images, n_col=n_col, n_row=n_row, cmap=plt.cm.gray):
    plt.figure(figsize=(2. * n_col, 2.26 * n_row))
    plt.suptitle(title, size=11)
    for i, comp in enumerate(images):
        plt.subplot(n_row, n_col, i + 1)
        vmax = max(comp.max(), -comp.min())
        plt.imshow(comp.reshape(image_shape), cmap=cmap,
                   interpolation='nearest',
                   vmin=-vmax, vmax=vmax)
        plt.xticks(())
        plt.yticks(())
    plt.subplots_adjust(0.01, 0.05, 0.99, 0.93, 0.04, 0.)


# #############################################################################
# List of the different estimators, whether to center and transpose the
# problem, and whether the transformer uses the clustering API.
estimators = [
    ('Non-negative components - NMF',
     decomposition.NMF(n_components=n_components, init='nndsvda', tol=5e-3),
     False),

    ('Orthogonal Projected Non-negative components - OPNMF',
     OPNMF(n_components=n_components, init='nndsvd', tol=5e-3),
     False),
]

plot_gallery("First centered Olivetti faces", faces_centered[:n_components])

# #############################################################################
# Do the estimation and plot it

for name, estimator, center in estimators:
    print("Extracting the top %d %s..." % (n_components, name))
    t0 = time()
    data = faces
    if center:
        data = faces_centered
    estimator.fit(data)
    train_time = (time() - t0)
    print("done in %0.3fs" % train_time)
    if hasattr(estimator, 'cluster_centers_'):
        components_ = estimator.cluster_centers_
    else:
        components_ = estimator.components_

    # Plot an image representing the pixelwise variance provided by the
    # estimator e.g its noise_variance_ attribute. The Eigenfaces estimator,
    # via the PCA decomposition, also provides a scalar noise_variance_
    # (the mean of pixelwise variance) that cannot be displayed as an image
    # so we skip it.
    if (hasattr(estimator, 'noise_variance_') and
            estimator.noise_variance_.ndim > 0):  # Skip the Eigenfaces case
        plot_gallery("Pixelwise variance",
                     estimator.noise_variance_.reshape(1, -1), n_col=1,
                     n_row=1)
    plot_gallery('%s - Train time %.1fs' % (name, train_time),
                 components_[:n_components])

plt.show()
Total running time of the script: ( 0 minutes 1.014 seconds)